| Guideline: Migration Planning Techniques | |
|
|
| Related Elements |
|---|
This chapter contains a number of techniques used to support migration planning in Phases E and F. Implementation Factor Assessment and Deduction MatrixThe technique of creating an Implementation Factor Assessment and Deduction matrix can be used to document factors impacting the architecture Implementation and Migration Plan. The matrix should include a list of the factors to be considered, their descriptions, and the deductions that indicate the actions or constraints that have to be taken into consideration when formulating the plans. An example matrix is shown in Implementation Factor Assessment and Deduction Matrix . 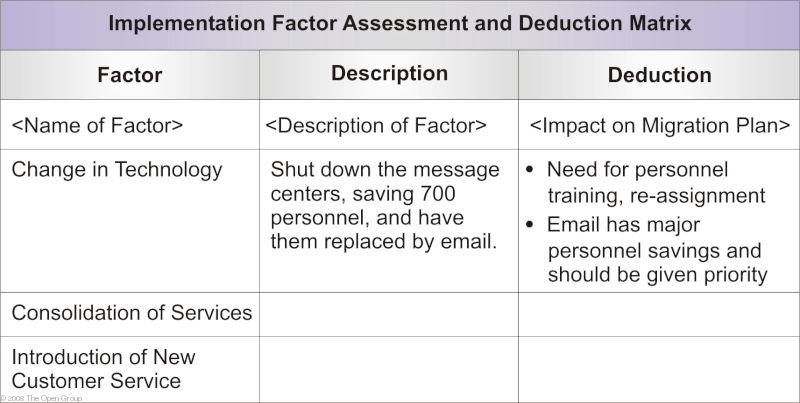 Consolidated Gaps, Solutions, and Dependencies MatrixThe technique of creating a Consolidated Gaps, Solutions, and Dependencies matrix allows the architect to group the gaps identified in the domain architecture gap analysis results and assess potential solutions and dependencies to one or more gaps. This matrix can be used as a planning tool when creating work packages. The identified dependencies will drive the creation of projects and migration planning in Phases E and F. An example matrix is shown in Consolidated Gaps, Solutions, and Dependencies Matrix . 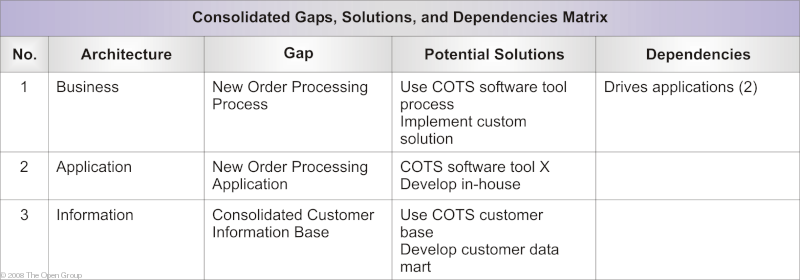 Architecture Definition Increments TableThe technique of creating an Architecture Definition Increment table allows the architect to plan a series of Transition Architectures outlining the status of the enterprise architecture at specified times. A table should be drawn up, as shown in Architecture Definition Increments Table , listing the projects and then assigning their incremental deliverables across the Transition Architectures. 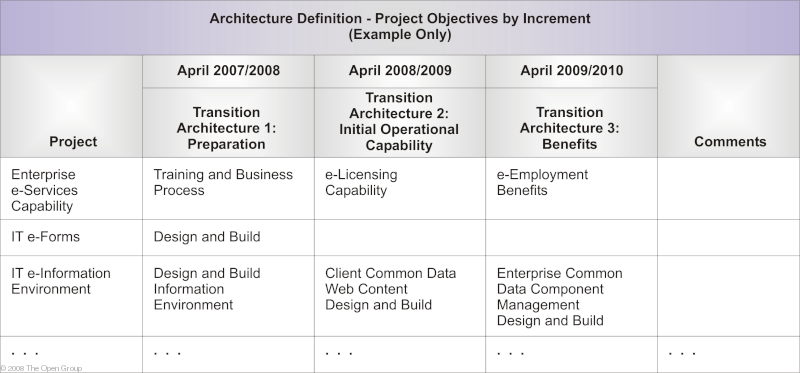 Enterprise Architecture State Evolution TableThe technique of creating the Enterprise Architecture State Evolution table allows the architect to show the proposed state of the architectures at various levels using the Technical Reference Model (TRM). A table should be drawn, listing the services from the TRM used in the enterprise, the Transition Architectures, and proposed transformations, as shown in Enterprise Architecture State Evolution Table . All Solution Building Blocks (SBBs) should be described with respect to their delivery and impact on these services. They should also be marked to show the progression of the enterprise architecture. In the example, where target capability has been reached, this is shown as "new" or "retain"; where capability is transitioned to a new solution, this is marked as "transition"; and where a capability is to be replaced, this is marked as "replace". 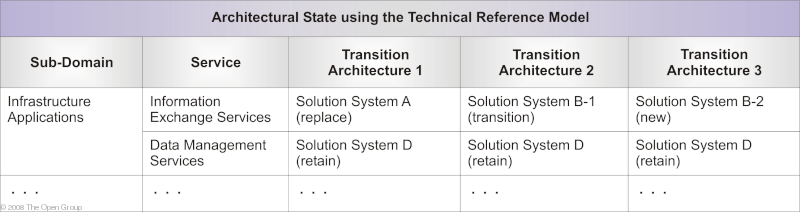
Another technique (not shown here) is to use color coding in the matrix; for example:
Business Value Assessment TechniqueA technique to assess business value is to draw up a matrix based on a value index dimension and a risk index dimension. An example is shown in Sample Project Assessment with Respect to Business Value and Risk . The value index should include criteria such as compliance to principles, financial contribution, strategic alignment, and competitive position. The risk index should include criteria such as size and complexity, technology, organizational capacity, and impact of a failure. Each criterion should be assigned an individual weight. The index and its criteria and weighting should be developed and approved by senior management. It is important to establish the decision-making criteria before the options are known. 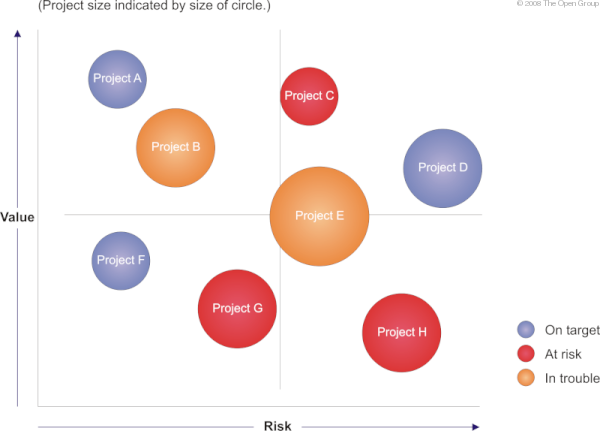
|
The Open Group gratefully acknowledge Capgemini for the creation of the Eclipse Process Framework Method Plugin for TOGAF9. Downloads of the TOGAF documentation, are available under license from the TOGAF information web site. The license is free to any organization wishing to use TOGAF entirely for internal purposes (for example, to develop an information system architecture for use within that organization). A book is also available (in hardcopy and pdf) from The Open Group Bookstore as document G091.
Copyright © 1999-2009 The Open Group, All Rights Reserved |